Conversational UIs and bots for news and information — Part 3
After exploring the possibilities of SMS, we moved to Twitter for the next stage of the project. This decision was mainly driven by cost: MEN would have to pay for Twilio (the service which powers the SMS functionality) and it would be difficult to recoup that money or justify spending it in the first place.
As it turned out, Twitter was an excellent medium for this kind of interaction. The character count enforced focus, while the idea of an inanimate object in the city sending a Twitter post somehow seemed more convincing than an SMS. The activity was embedded in an object in the city which spoke in the first person, expressed itself through Twitter and even had a glimmer of personality.
The focus of this sprint was being useful, which involved answering as many possible questions as possible and then testing them with users to see which ones they actually did find useful.
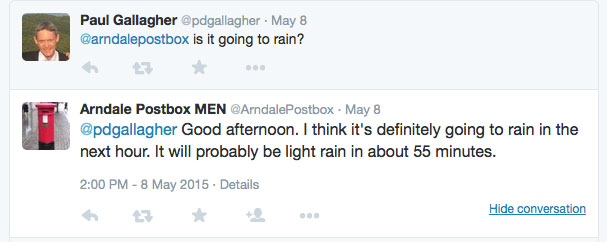
Is it going to rain?
We started off with the weather. Rather than churning out a general weather forecast we decided to try to answer the question, “Is it going to rain in the next hour?” We took the detailed forecast from forecast.io, examined the probability and intensity of rain in the next hour and used it to answer the question. It worked quite well:
What’s the news around here?
The news also worked well on Twitter thanks to the cards display.
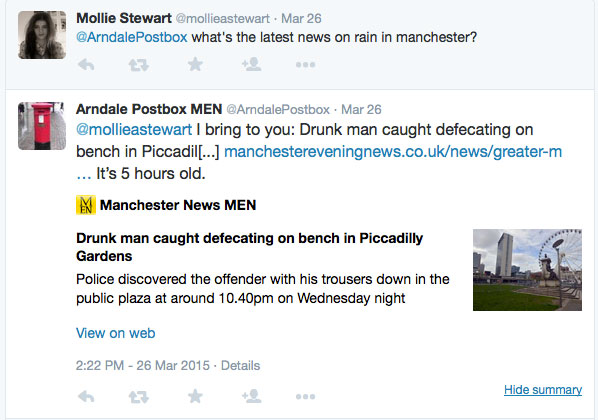
The medium exposed problems in the content itself: it wasn’t specific enough or regular enough to power this system satisfactorily. The MEN is taking on a city centre blogger, so there will be more relevant content in the future, but the conversational UI does enforce the idea of specifically answering user needs — it’s a question / answer format after all. For this to work well, the content would need to be structured around specific locations and taxonomies. If it was tagged by things like type or mood, we could start to experiment with allowing the user to customise the service by replying to the Twitter post, which opens up all sorts of interesting possibilities.
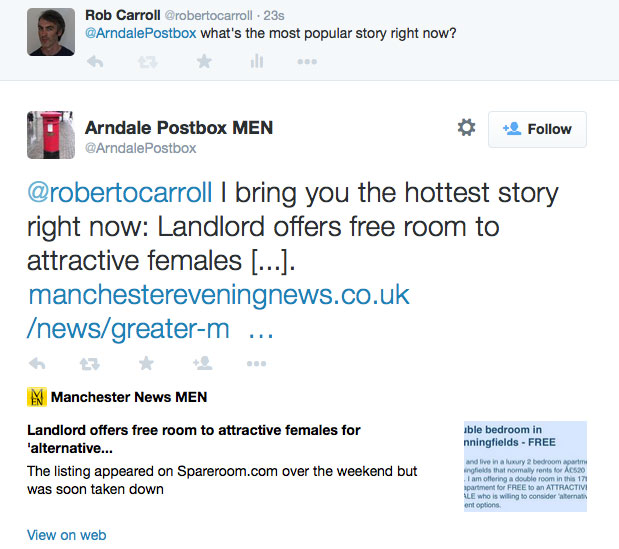
What’s the most popular news around here?
We used the Chartbeat API to get the local article which is being shared the most on Facebook, Twitter, etc. It worked quite well, although the wording “hottest” story needs to be changed to accommodate all possible stories.
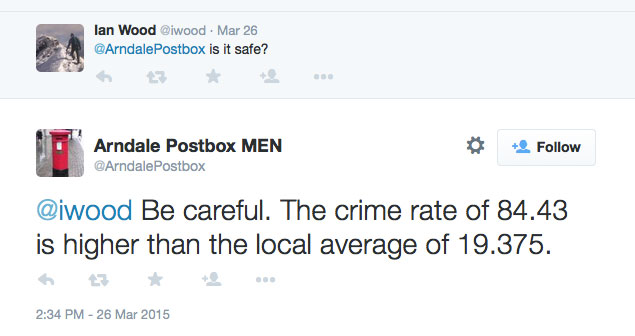
Crime statistics
The API at http://data.police.uk has lots of information about specific crimes as well as more general statistics. One option is to show specific crimes at a particular location along with their outcomes. We combined the details such as location, type of crime and the outcome for a single incident into a sentence. Tweet “random crime” and the postbox will reply with one of thousands of crimes from December 2014 that actually happened nearby.
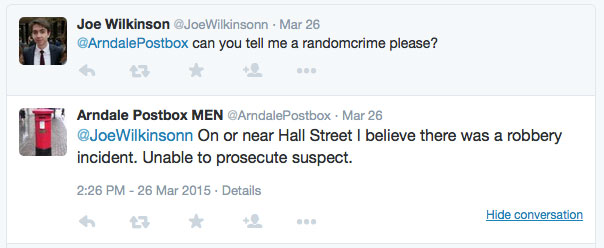
Each tweet gives you a sense of what crime incidents happen in the area as well as their outcome. We felt the randomness reflects — in limited ways — the nature of crime itself. I urge you to try it for yourself.
The general statistics didn’t work quite so well. The idea was that by comparing statistics such the crime rate and total crimes to neighbouring areas you would get a sense of how safe a place was. The city centre’s small population gave it a crime rate of 84.43 and using the total crimes wasn’t easy to convey in a single tweet. There’s still lots to explore with this data.
Election
The general election was coming up as we were working on this sprint so we decided to try incorporating information about the candidates from YourNextMP. It would have been good to find out more about the candidate for a particular party, but the fragility and weakness of the conversational UI emerged since it’s difficult to inform a user about all the different parties in a single tweet. So we settled for random, giving users a broad sense of which candidates were standing and perhaps exposing people to less-well-known candidates.
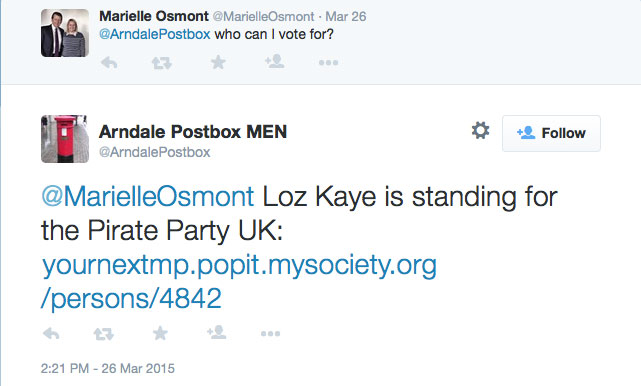
It was also difficult to convey the distinction between this is who you should vote for and this is who you could vote for, since the tweet was not a recommendation.
Information gathering
Having an extended conversation was always going to be tricky, but we tried it as a way of gathering interesting subjective information from people about their neighbourhood. We asked questions about the neighbourhood and showed someone else’s answer along with the next question.
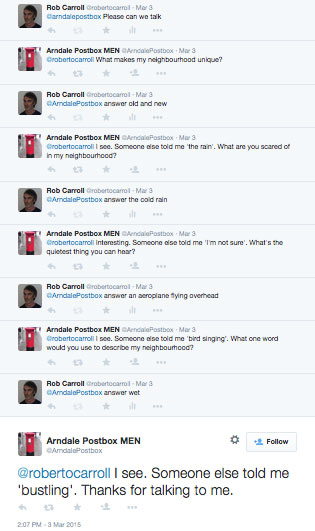
There were all sorts of problems here including needing to type “answer” to keep the conversation going, problems around the possibility of rude words from mischievous users and the general clunkiness, but it might be worth exploring in different ways in the future.
Service discovery
The final conversation used information about burger restaurants from an MEN article to provide recommendations of a place to eat. At the moment, the suggestion is random:
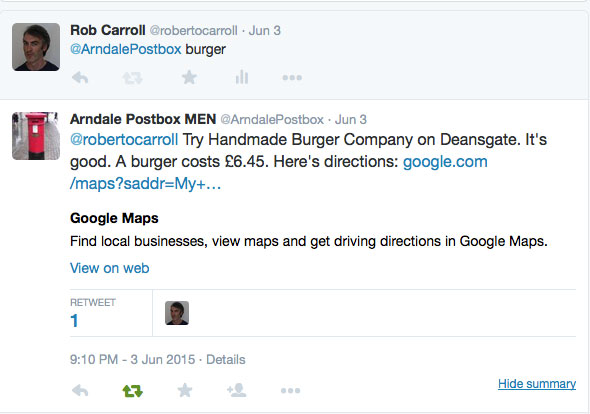
You get details about the rating — poor, not bad, OK, good and great — as well as the cost of a burger and directions from the postbox. This service was the most popular by far as well as the easiest for people to understand, so we are going to work on improving it in the next sprint.
Conclusions
It was a great sprint exploring a range of different directions with good reaction from users in general to the concept. Here’s some of the things we learnt:
- The conversational UI feels useful and provides something different to other ways of interacting with MEN.
- The conversational UI is flexible and transferable — SMS, Twitter, WhatsApp, etc may have different affordances — but creating content in a general conversational format means the engine could be used to run different outlets without too much extra effort.
- The conversational UI creates an interesting interface on top of various city APIs which would otherwise be difficult to access. Lots of editorial and data work could be done to create useful and interesting information which answers a specific need, e.g. rain, crime. Other possible sources include school data, census data, transport information and sensor data.
- The first person framing could be a good place to explore presenting stories by emotion, e.g. awe-inspiring, emotional, positive and surprising.
- There are interesting possibilities for gathering information by mixing automated replies along with routing to a human elsewhere.
What next?
Service discovery was by far the most popular function with users. They immediately grasped the idea and thought it was useful. So we are going to create a new Twitter account for the Piccadilly Wall in the city centre and use it to find nearby burger restaurants. People will be able to filter the information, eg cheapest, best, nearest, random, cleanest using the command first followed by modifier, ie ‘burger cheapest’.
We are also going to explore the commercial possibilities. What if a person had to retweet the recommendation to get a discount? The place would get publicity to the person’s followers and it would be unrepeatable, i.e. you need the retweet on your timeline to get the discount.
There were also some technical issues around JSON parsing errors, repeated tweets and character counts which we hope to work on to improve the experience.
It’s been great to work on this project which is not over yet. Thanks to the Manchester Evening News for the opportunity. If “designing for messaging” does “become a discipline as important as responsive design”, we hope to be at the forefront of these developments, blending writing and programming to create new experiences for 21st-century journalism.
This post is part of a series about a project exploring conversational UIs for news and information to help Manchester Evening News become part of the fabric of the city.